What did the gap mean to you?
Read for gap interpretation. Keep the specific explanation in the respondent’s own words rather than converting it into an unexplained overall satisfaction score.
Product and software research · A focused questionnaire
Clarify absent chart values.
Opens product registration. Example questions are not imported automatically.
WHAT TO READ · WHAT TO TEST
Missing values appear identical to zeros.
Do not infer absence means poor performance.
Label absent data separately from zero.
Illustrative scenario. These are not real response counts or findings.
A useful starting point
Clarify absent chart values. These prompts examine gap interpretation, legend need, explanation. Choose only questions your audience can answer. A missing detail can be answered with none; do not assume an issue occurred.
If nothing was unclear or difficult, say so. Skip questions about steps you did not experience; use not applicable where appropriate.
Read for gap interpretation. Keep the specific explanation in the respondent’s own words rather than converting it into an unexplained overall satisfaction score.
Read for legend need. Keep the specific explanation in the respondent’s own words rather than converting it into an unexplained overall satisfaction score.
Read for explanation. Keep the specific explanation in the respondent’s own words rather than converting it into an unexplained overall satisfaction score.
If nothing was unclear or difficult, say so. Skip questions about steps you did not experience; use not applicable where appropriate.

What did the gap mean to you?
Which legend detail was missing?
What explanation would help?
Download the questions as text ↓
Examples to adapt, rather than a validated research instrument.
A worked interpretation example
Illustrative scenario. These are not customer results.
Missing values appear identical to zeros.
Label absent data separately from zero.
After testing this change—Label absent data separately from zero.—ask people who encountered the changed arrangement whether this original issue still occurred or did not occur: “Missing values appear identical to zeros.” Invite a concrete explanation, including none or not applicable. Compare participant context and sample differences; a before-and-after survey alone does not establish causation.
Choose the response format
| Question | Suggested format | What to preserve |
|---|---|---|
| What did the gap mean to you? | Optional free text; none or not applicable accepted | Read for gap interpretation. Keep the specific explanation in the respondent’s own words rather than converting it into an unexplained overall satisfaction score. |
| Which legend detail was missing? | Optional free text; none or not applicable accepted | Read for legend need. Keep the specific explanation in the respondent’s own words rather than converting it into an unexplained overall satisfaction score. |
| What explanation would help? | Optional free text; none or not applicable accepted | Read for explanation. Keep the specific explanation in the respondent’s own words rather than converting it into an unexplained overall satisfaction score. |
Make questions optional where appropriate. If you add a rating scale, label its endpoints, keep one idea per question, and retain a follow-up for reasons. These examples are not a validated measurement instrument.
Before you send it
Would you agree that this entire experience was clear and easy?
What did the gap mean to you?
The first wording assumes a positive outcome and combines clarity with ease. The revised prompt asks about the concrete situation; respondents may report no difficulty.
From question to next step
Clarify absent chart values.
Ask after an adult respondent has encountered this specific situation. For draft-copy testing, show the actual material first; accept none or not applicable when the issue did not occur.
Label absent data separately from zero.
Read the answers carefully
Do not infer absence means poor performance.
Missing values appear identical to zeros. This is an illustrative pattern, not observed customer data. Do not infer absence means poor performance.
Before you send it
Product users who attempted the specific interface or workflow task; use synthetic examples without private records. Ask only about the step each person actually encountered; voluntary responses are not automatically representative.
Read for gap interpretation. Keep the specific explanation in the respondent’s own words rather than converting it into an unexplained overall satisfaction score. It supports this decision: Clarify absent chart values.
Read for legend need. Keep the specific explanation in the respondent’s own words rather than converting it into an unexplained overall satisfaction score.
Read for explanation. Keep the specific explanation in the respondent’s own words rather than converting it into an unexplained overall satisfaction score. Do not infer absence means poor performance.
Label absent data separately from zero. After testing this change—Label absent data separately from zero.—ask people who encountered the changed arrangement whether this original issue still occurred or did not occur: “Missing values appear identical to zeros.” Invite a concrete explanation, including none or not applicable. Compare participant context and sample differences; a before-and-after survey alone does not establish causation.
The page offers text, CSV, JSON and Markdown downloads plus manual copying. Registration does not import the questionnaire. Use account-supported features and verify your own response-handling arrangements.
Inside the product
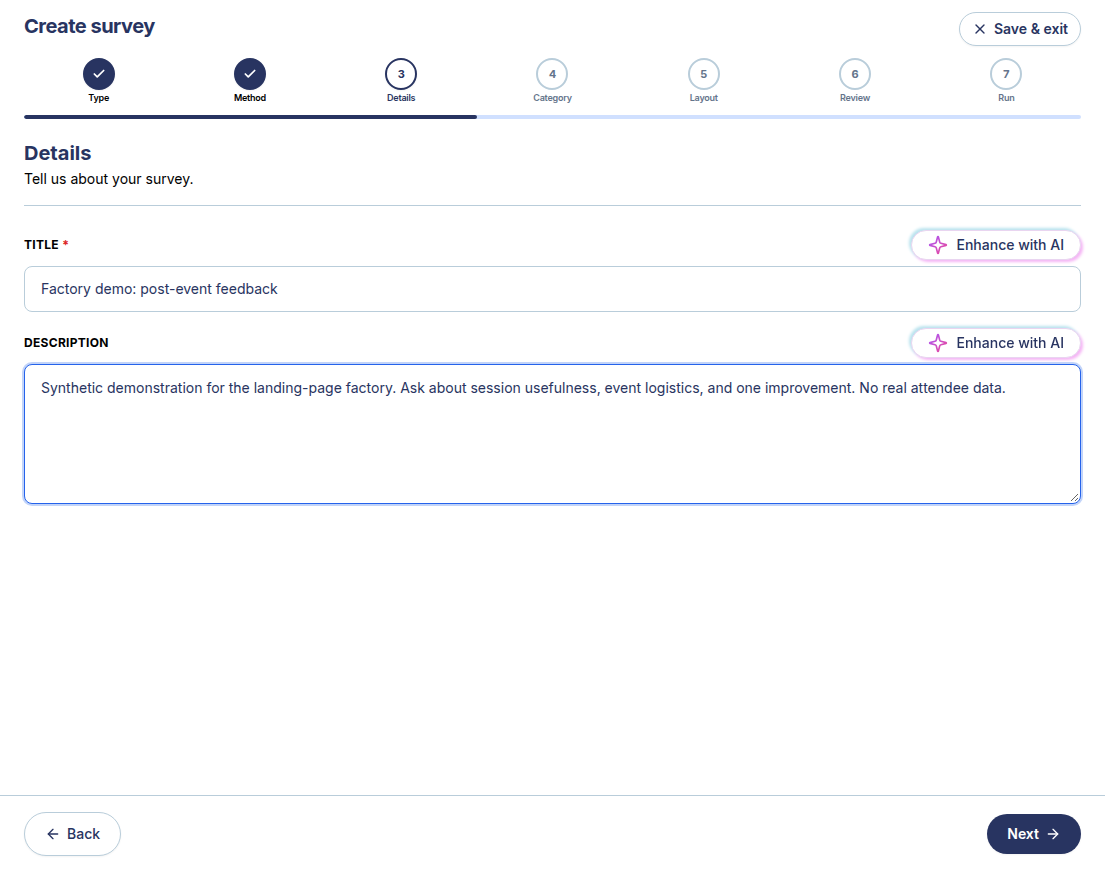
The real SurveyTeams screenshot shows a separate labelled synthetic event survey. It demonstrates the manual builder, not this questionnaire already loaded and not the task described in the software being evaluated.
Creation and preview were exercised in the observed account. Distribution, results and other features are separate workflows and depend on account conditions.
Build with SurveyTeams
Use these examples to draft your questionnaire. Create a survey draft, add questions, and check the respondent preview in SurveyTeams. Additional features depend on your account and plan.
Opens product registration. Example questions are not imported automatically.
Learn about the product ↗Continue exploring